


 生徒
生徒博士、Webサイトのパフォーマンスをチェックするために毎回手動でLighthouseを実行するのが大変なんです。もっと自動化できる方法はないですか?
 ペン博士
ペン博士それなら「Lighthouse CI」を使うんじゃ!GitHubにコードをpushするたびに自動でパフォーマンスをチェックしてくれるんじゃよ。今回はLighthouse CIの導入から、GitHub Actionsとの連携、Core Web Vitalsの自動監視まで、実践的な内容を詳しく解説するぞい!
 生徒
生徒ありがとうございます!よろしくお願いします!
Webサイトのパフォーマンス測定において、GoogleのLighthouseは非常に強力なツールです。しかし、手動での計測には以下のような課題があります:
本記事では、Lighthouse CIを使ったパフォーマンス自動計測の実装方法について、導入から実践的な活用まで、実例を踏まえて徹底的に解説します。
詳しくはこちらの記事をご覧ください。

片山さんの主な制作実績はこちら

Lighthouse CI(LHCI)は、GoogleのLighthouseをコマンドラインで実行し、CI/CDパイプラインに組み込むためのツールです。
通常のLighthouseとの違い:
| 機能 | 通常のLighthouse | Lighthouse CI |
|---|---|---|
| 実行方法 | Chrome DevTools / CLI | CLI / CI/CD自動実行 |
| 実行タイミング | 手動 | 自動(コミット/PR時) |
| 複数ページ測定 | 1ページずつ手動 | 設定ファイルで一括指定 |
| 閾値チェック | 目視確認 | 自動判定・ビルド失敗 |
| 履歴管理 | なし | Lighthouse Server / Temporary Public Storage |
Lighthouse CIは以下の機能を提供します:
Lighthouse CIでは、以下の指標を自動で測定できます:
 生徒
生徒Lighthouse CIを導入するメリットって何ですか?
 ペン博士
ペン博士うむ。ここでは、Lighthouse CIを導入するメリットについて解説するぞ!
コードをコミットするたびに自動でチェックされるため、パフォーマンスが悪化した場合にすぐに気づけます。
従来の方法:
Lighthouse CI導入後:
GoogleのSEOランキング要因であるCore Web Vitals(LCP、FID、CLS)を常に監視できます。
設定例:
// lighthouserc.json
{
  "ci": {
    "assert": {
      "assertions": {
        "largest-contentful-paint": ["error", {"maxNumericValue": 2500}],
        "first-input-delay": ["error", {"maxNumericValue": 100}],
        "cumulative-layout-shift": ["error", {"maxNumericValue": 0.1}]
      }
    }
  }
}これにより、SEOに悪影響を与える前に問題を検知できます。
Pull Requestにパフォーマンスレポートが自動で追加されるため、チーム全員がパフォーマンスを意識するようになります。
レビュー時のチェック項目:
手動でLighthouseを実行する必要がなくなり、計測にかかる時間を大幅削減できます。
| 作業 | 手動 | Lighthouse CI |
|---|---|---|
| 1ページの計測 | 約3分 | 自動(0分) |
| 10ページの計測 | 約30分 | 自動(0分) |
| 月間計測回数 | 数回(忘れがち) | コミットごと(数十〜数百回) |
 生徒
生徒メリットは分かったんですけど、実際どうやって導入するんですか?
 ペン博士
ペン博士いい質問じゃ。ここでは、実際にLighthouse CIをプロジェクトに導入する手順を詳しく解説するぞ!
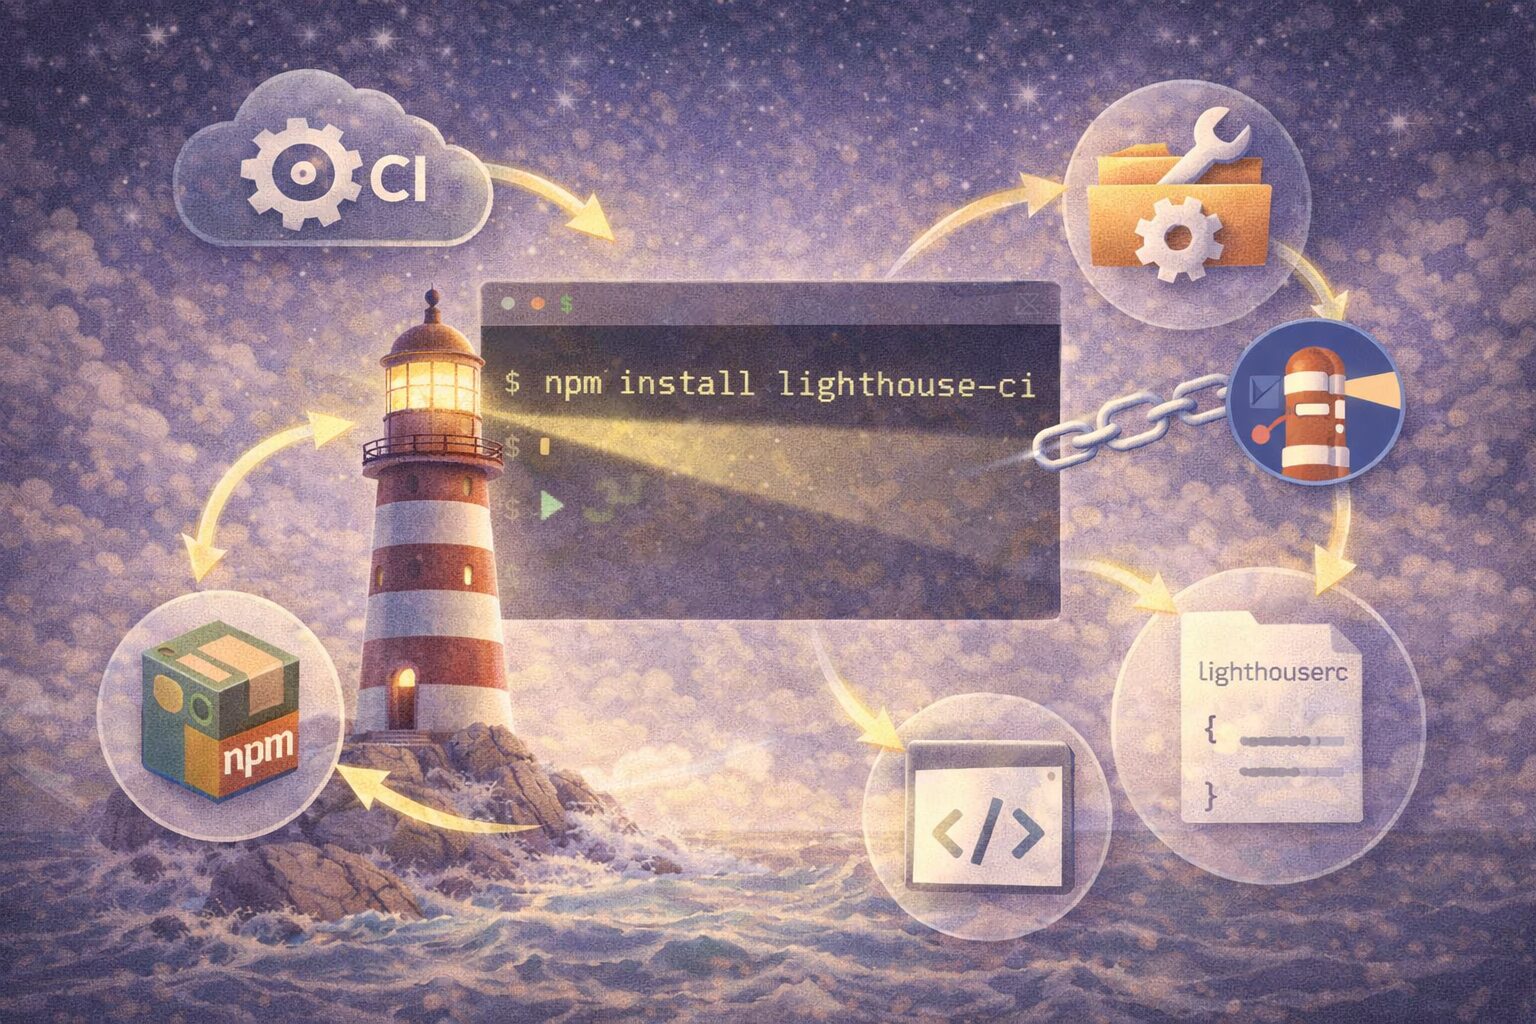
npmまたはyarnでインストールします。
# npmの場合
npm install -D @lhci/cli
# yarnの場合
yarn add -D @lhci/cli
package.jsonのdevDependenciesに追加されます:
// package.json
{
  "devDependencies": {
    "@lhci/cli": "^0.13.0"
  }
}プロジェクトルートにlighthouserc.jsonを作成します。
// lighthouserc.json
{
  "ci": {
    "collect": {
      // 計測回数(複数回実行して平均を取る)
      "numberOfRuns": 3,
      // ビルド後の静的ファイルがあるディレクトリ
      "staticDistDir": "./build",
      // または、開発サーバーを起動する場合
      // "startServerCommand": "npm run start",
      // 計測するURL(複数指定可能)
      "url": [
        "http://localhost:3000/",
        "http://localhost:3000/about",
        "http://localhost:3000/contact"
      ]
    },
    "assert": {
      // スコアやメトリクスの閾値を設定
      "assertions": {
        "categories:performance": ["error", {"minScore": 0.9}],
        "categories:accessibility": ["warn", {"minScore": 0.9}],
        "categories:best-practices": ["warn", {"minScore": 0.9}],
        "categories:seo": ["warn", {"minScore": 0.9}],
        // Core Web Vitals
        "largest-contentful-paint": ["error", {"maxNumericValue": 2500}],
        "first-input-delay": ["error", {"maxNumericValue": 100}],
        "cumulative-layout-shift": ["error", {"maxNumericValue": 0.1}],
        // その他のメトリクス
        "first-contentful-paint": ["warn", {"maxNumericValue": 2000}],
        "speed-index": ["warn", {"maxNumericValue": 3000}],
        "total-blocking-time": ["warn", {"maxNumericValue": 300}]
      }
    },
    "upload": {
      // 結果の保存先(オプション)
      "target": "temporary-public-storage"
    }
  }
}collect(計測設定):
numberOfRuns:実行回数(3〜5回推奨)staticDistDir:静的ファイルのディレクトリstartServerCommand:サーバー起動コマンドurl:計測対象のURL配列assert(閾値設定):
["error", {...}]:基準未達時にビルド失敗["warn", {...}]:基準未達時に警告のみminScore:最低スコア(0〜1の範囲)maxNumericValue:最大値(ミリ秒単位)// package.json
{
"scripts": {
"build": "next build",
"lighthouse": "lhci autorun",
"lighthouse:collect": "lhci collect",
"lighthouse:assert": "lhci assert",
"lighthouse:upload": "lhci upload"
}
}コマンドの説明:
lhci autorun:collect、assert、uploadを一括実行lhci collect:Lighthouseを実行して結果を収集lhci assert:収集した結果を閾値と比較lhci upload:結果をサーバーにアップロード# ビルド
npm run build
# Lighthouse CI実行
npm run lighthouse実行すると、以下のような出力が表示されます:
Collecting Lighthouse results
Running Lighthouse 3 time(s) on http://localhost:3000/
   Run #1...done.
   Run #2...done.
   Run #3...done.
Done collecting Lighthouse results.
Asserting against Lighthouse results
   ✓ categories:performance: minScore assertion passed
   ✓ largest-contentful-paint: maxNumericValue assertion passed
   ✓ cumulative-layout-shift: maxNumericValue assertion passed
All assertions passed!
Uploading Lighthouse results
✓ Uploaded to https://storage.googleapis.com/...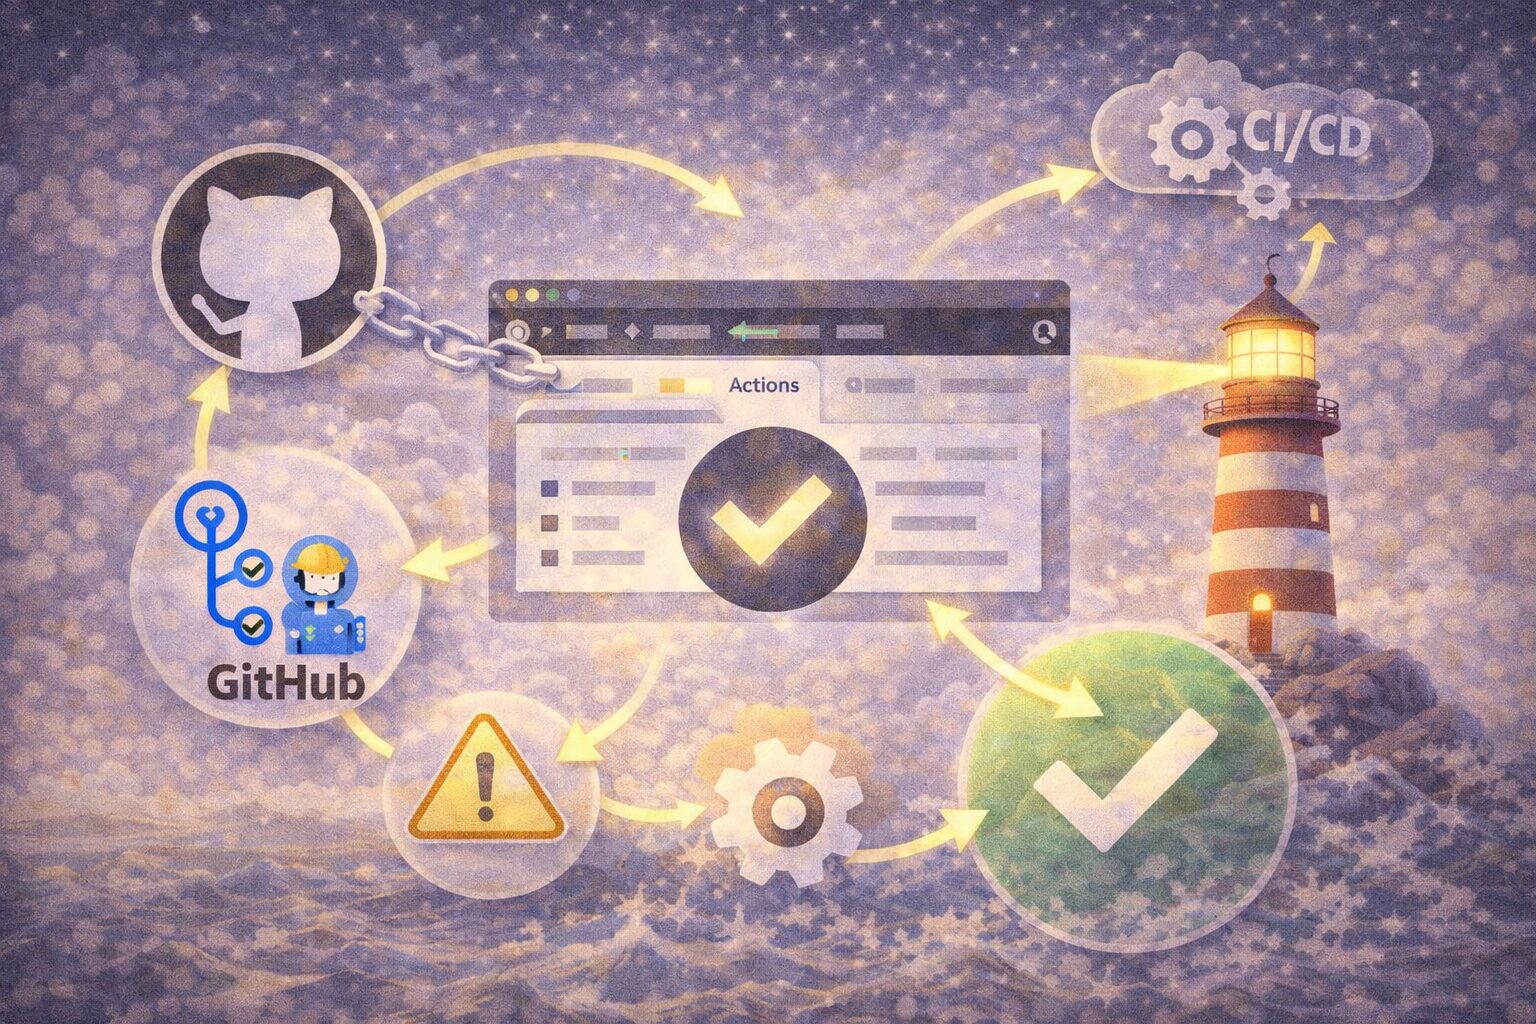 ペン博士
ペン博士Lighthouse CIの本領は自動化してこそじゃ。特にGitHub Actionsとの相性が良い。ここでは、GitHub Actionsを使って、自動でLighthouse CIを実行する方法を解説するぞ!
生徒そうなんですね!よろしくお願いします!
.github/workflows/lighthouse-ci.ymlを作成します。
# .github/workflows/lighthouse-ci.yml
name: Lighthouse CI
on:
  pull_request:
    branches: [main, develop]
  push:
    branches: [main]
jobs:
  lighthouse-ci:
    runs-on: ubuntu-latest
    steps:
      # リポジトリをチェックアウト
      - uses: actions/checkout@v3
      # Node.jsのセットアップ
      - name: Setup Node.js
        uses: actions/setup-node@v3
        with:
          node-version: 18
          cache: 'npm'
      # 依存関係のインストール
      - name: Install dependencies
        run: npm ci
      # ビルド
      - name: Build project
        run: npm run build
      # Lighthouse CI実行
      - name: Run Lighthouse CI
        run: npm run lighthouse
        env:
          LHCI_GITHUB_APP_TOKEN: ${{ secrets.LHCI_GITHUB_APP_TOKEN }}
      # 結果をアーティファクトとして保存
      - name: Upload Lighthouse reports
        uses: actions/upload-artifact@v3
        if: always()
        with:
          name: lighthouse-reports
path: .lighthouseci/Lighthouse CIの結果をPull Requestにコメントとして追加する設定:
# .github/workflows/lighthouse-ci.yml(続き)
jobs:
  lighthouse-ci:
    # ...(前述の設定)
    steps:
      # ...(前述のステップ)
      # Lighthouse CI実行(コメント機能付き)
      - name: Run Lighthouse CI with comment
        uses: treosh/lighthouse-ci-action@v10
        with:
          urls: |
            http://localhost:3000
            http://localhost:3000/about
          uploadArtifacts: true
          temporaryPublicStorage: true
          runs: 3
この設定により、Pull Requestに以下のようなコメントが自動追加されます:
## Lighthouse CI Results
### http://localhost:3000
| Category | Score |
|----------|-------|
| Performance | 95 +2 |
| Accessibility | 100 |
| Best Practices | 92 -3 |
| SEO | 100 |
**Core Web Vitals**
- LCP: 1.8s
- FID: 15ms
- CLS: 0.05
[View full report](https://storage.googleapis.com/...)
本番環境、ステージング環境など、複数の環境で計測する設定:
# .github/workflows/lighthouse-ci.yml
name: Lighthouse CI - Multi Environment
on:
  pull_request:
    branches: [main]
jobs:
  lighthouse-ci:
    runs-on: ubuntu-latest
    strategy:
      matrix:
        environment: [staging, production]
    steps:
      - uses: actions/checkout@v3
      - uses: actions/setup-node@v3
        with:
          node-version: 18
      - name: Install dependencies
        run: npm ci
      - name: Run Lighthouse CI - ${{ matrix.environment }}
        uses: treosh/lighthouse-ci-action@v10
        with:
          urls: |
            ${{ matrix.environment == 'staging' && 'https://staging.example.com' || 'https://example.com' }}
          uploadArtifacts: true
runs: 3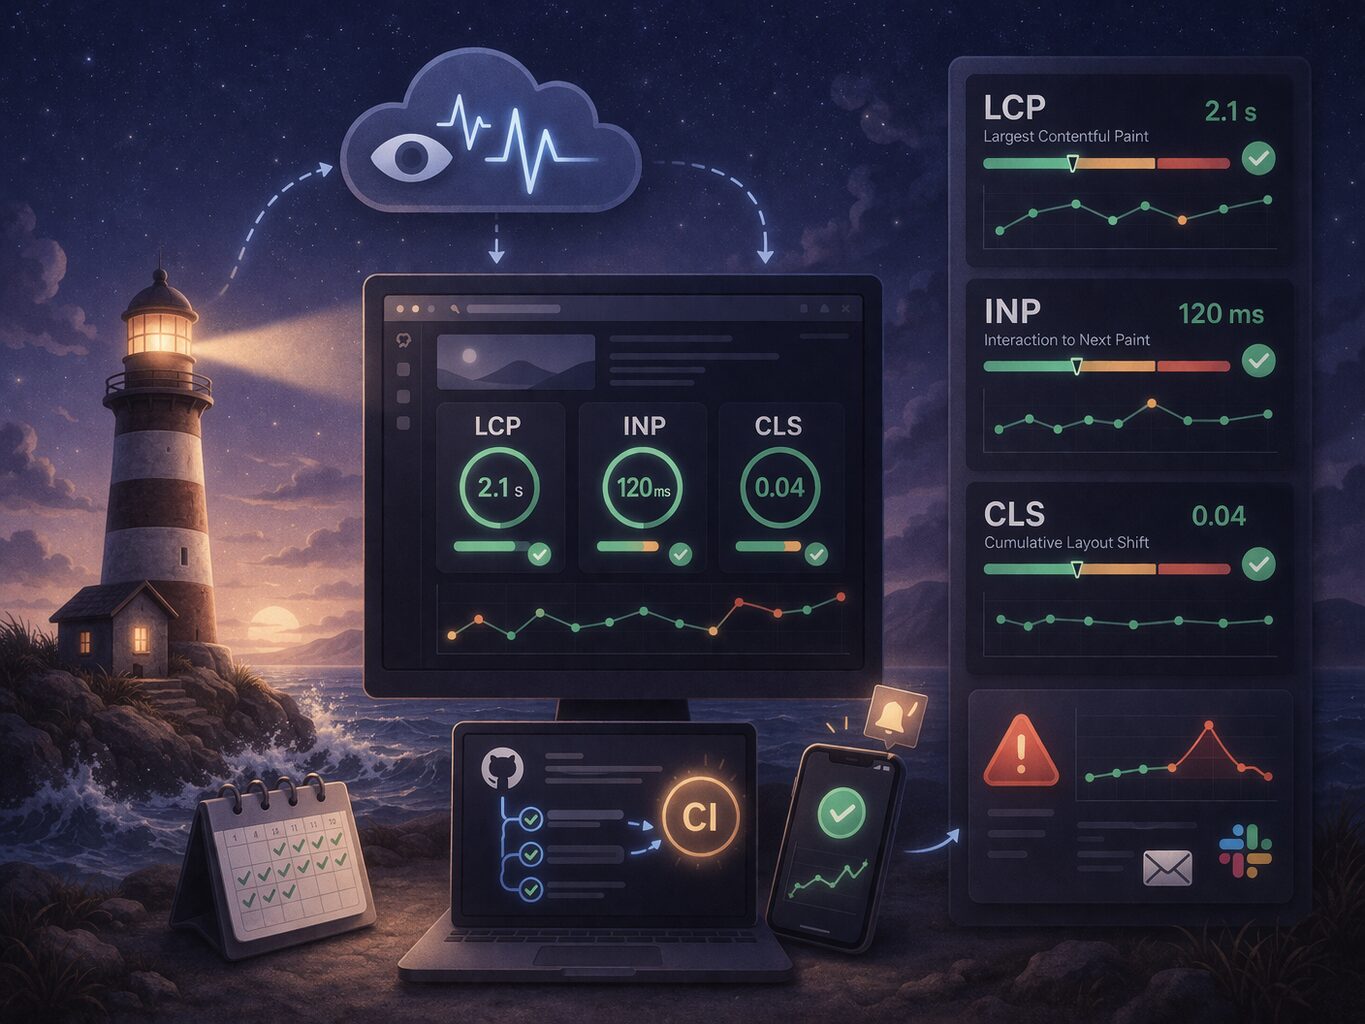 生徒
生徒Lighthouseってスコア見るだけじゃダメなんですか?
 ペン博士
ペン博士それは違うぞ。継続的に監視しないと意味がない。特にCore Web Vitalsは別物と考えた方がいい。ここでは、GoogleのSEOランキング要因であるCore Web Vitalsを継続的に監視する方法を解説するぞ!
Core Web Vitalsは、ユーザーエクスペリエンスを測定する3つの指標です:
意味: ページの主要コンテンツが表示されるまでの時間
良好な値: 2.5秒以内
改善方法:
意味: ユーザーが最初にページを操作してから、ブラウザが応答するまでの時間
良好な値: 100ミリ秒以内
改善方法:
意味: ページ読み込み中のレイアウトのずれ
良好な値: 0.1以下
改善方法:
// lighthouserc.json
{
  "ci": {
    "assert": {
      "preset": "lighthouse:no-pwa",
      "assertions": {
        // Core Web Vitals(厳格)
        "largest-contentful-paint": [
          "error",
          {"maxNumericValue": 2000, "aggregationMethod": "optimistic"}
        ],
        "first-input-delay": [
          "error",
          {"maxNumericValue": 80}
        ],
        "cumulative-layout-shift": [
          "error",
          {"maxNumericValue": 0.08}
        ],
        // 追加のパフォーマンス指標
        "first-contentful-paint": [
          "warn",
          {"maxNumericValue": 1500}
        ],
        "speed-index": [
          "warn",
          {"maxNumericValue": 2500}
        ],
        "total-blocking-time": [
          "error",
          {"maxNumericValue": 200}
        ],
        "interactive": [
          "warn",
          {"maxNumericValue": 3500}
        ],
        // リソースサイズ
        "resource-summary:script:size": [
          "warn",
          {"maxNumericValue": 300000}
        ],
        "resource-summary:stylesheet:size": [
          "warn",
          {"maxNumericValue": 50000}
        ],
        "resource-summary:image:size": [
          "warn",
          {"maxNumericValue": 500000}
        ],
        // カテゴリースコア
        "categories:performance": ["error", {"minScore": 0.95}],
        "categories:accessibility": ["warn", {"minScore": 0.95}],
        "categories:best-practices": ["warn", {"minScore": 0.9}],
        "categories:seo": ["error", {"minScore": 0.95}]
      }
    }
  }
}Slackに通知を送る設定:
# .github/workflows/lighthouse-ci.yml
jobs:
  lighthouse-ci:
    steps:
      # ...(前述のステップ)
      - name: Run Lighthouse CI
        id: lighthouse
        continue-on-error: true
        run: npm run lighthouse
      # 失敗時にSlack通知
      - name: Notify Slack on failure
        if: steps.lighthouse.outcome == 'failure'
        uses: slackapi/slack-github-action@v1
        with:
          payload: |
            {
              "text": "Lighthouse CI Failed",
              "blocks": [
                {
                  "type": "section",
                  "text": {
                    "type": "mrkdwn",
                    "text": "*Lighthouse CI failed on PR #${{ github.event.number }}*\n\nCore Web Vitals did not meet the threshold.\n\n<${{ github.event.pull_request.html_url }}|View Pull Request>"
                  }
                }
              ]
            }
        env:
SLACK_WEBHOOK_URL: ${{ secrets.SLACK_WEBHOOK_URL }} 生徒
生徒Lighthouse CI運用するにあたってトラブルシューティングのことも知りたいです!
ペン博士うむ。ここでは、主なトラブルシューティングを3つ紹介するぞい!
症状: 同じページなのに、実行するたびにスコアが大きく変わる
原因:
解決策:
// lighthouserc.json
{
  "ci": {
    "collect": {
      // 実行回数を増やす(3〜5回推奨)
      "numberOfRuns": 5,
      // 集計方法を指定
      "settings": {
        // ネットワークスロットリングを有効化
        "throttlingMethod": "simulate",
        "throttling": {
          "rttMs": 40,
          "throughputKbps": 10240,
          "cpuSlowdownMultiplier": 1
        }
      }
    },
    "assert": {
      "assertions": {
        // 楽観的な値(最良の実行結果)を使用
        "largest-contentful-paint": [
          "error",
          {
            "maxNumericValue": 2500,
            "aggregationMethod": "optimistic"
          }
        ]
      }
    }
  }
}症状: Lighthouse CI実行中にGitHub Actionsがタイムアウト
解決策:
# .github/workflows/lighthouse-ci.yml
jobs:
  lighthouse-ci:
    # タイムアウトを延長
    timeout-minutes: 30
    steps:
      # キャッシュを活用して高速化
      - name: Cache dependencies
        uses: actions/cache@v3
        with:
          path: ~/.npm
          key: ${{ runner.os }}-node-${{ hashFiles('**/package-lock.json') }}
      # ビルドキャッシュも活用
      - name: Cache build
        uses: actions/cache@v3
        with:
          path: .next/cache
key: ${{ runner.os }}-nextjs-${{ hashFiles('**/package-lock.json') }}症状: ローカル/CIのスコアは良好だが、本番環境のスコアが低い
原因:
解決策:
// lighthouserc.json
{
  "ci": {
    "collect": {
      // 本番環境のURLで計測
      "url": [
        "https://example.com",
        "https://example.com/about"
      ],
      // 本番環境と同じヘッダーを送信
      "settings": {
        "extraHeaders": {
          "Cookie": "session=...",
          "Authorization": "Bearer ..."
        }
      }
    }
  }
}
また、本番環境専用のワークフローを作成:
# .github/workflows/lighthouse-production.yml
name: Lighthouse CI - Production
on:
  schedule:
    # 毎日午前3時に実行
    - cron: '0 3 * * *'
  workflow_dispatch:
jobs:
  lighthouse-production:
    runs-on: ubuntu-latest
    steps:
      - uses: actions/checkout@v3
      - name: Run Lighthouse on production
        uses: treosh/lighthouse-ci-action@v10
        with:
          urls: |
            https://example.com
            https://example.com/about
            https://example.com/products
          uploadArtifacts: true
runs: 5Lighthouse CIを使えば、パフォーマンスを常に監視できるんですね!これならユーザーに快適なサイトを提供し続けられます。
ペン博士その通りじゃ!一度設定すれば、あとは自動で監視してくれるから、パフォーマンスの劣化に気づけるんじゃ。SEOにも良い影響があるぞい!
 生徒
生徒早速試してみます!ありがとうございました!
本記事では、Lighthouse CIを使ったパフォーマンス自動計測の実装方法について、実践的な内容を解説しました。
重要なポイントは以下の通りです。
・Lighthouse CIとは:Lighthouseをコマンドラインで実行し、CI/CDに組み込めるツール
・導入のメリット:パフォーマンス劣化の早期発見、Core Web Vitalsの継続監視、チーム全体での品質向上
・導入方法:npm install、lighthouserc.json作成、package.jsonにスクリプト追加
・GitHub Actions連携:Pull Request時に自動実行、結果をコメントで共有
・Core Web Vitals監視:LCP、FID、CLSの閾値設定で自動判定
・トラブルシューティング:スコアの変動対策、タイムアウト対応、本番環境との差異解消
Lighthouse CIを導入することで、パフォーマンスを継続的に監視し、ユーザーエクスペリエンスを常に高く保つことができます。
まずは小規模なプロジェクトから始めて、lighthouserc.jsonの基本設定を試してみましょう。慣れてきたら、GitHub Actionsとの連携や、より厳格な閾値設定にチャレンジしてください。

副業・フリーランスが主流になっている今こそ、自らのスキルで稼げる人材を目指してみませんか?
未経験でも心配することはありません。初級コースを受講される方の大多数はプログラミング未経験です。まずは無料カウンセリングで、悩みや不安をお聞かせください!
公式サイト より
今すぐ
無料カウンセリング
を予約!